Punjab and Haryana: One border, two destinies
Visualisation
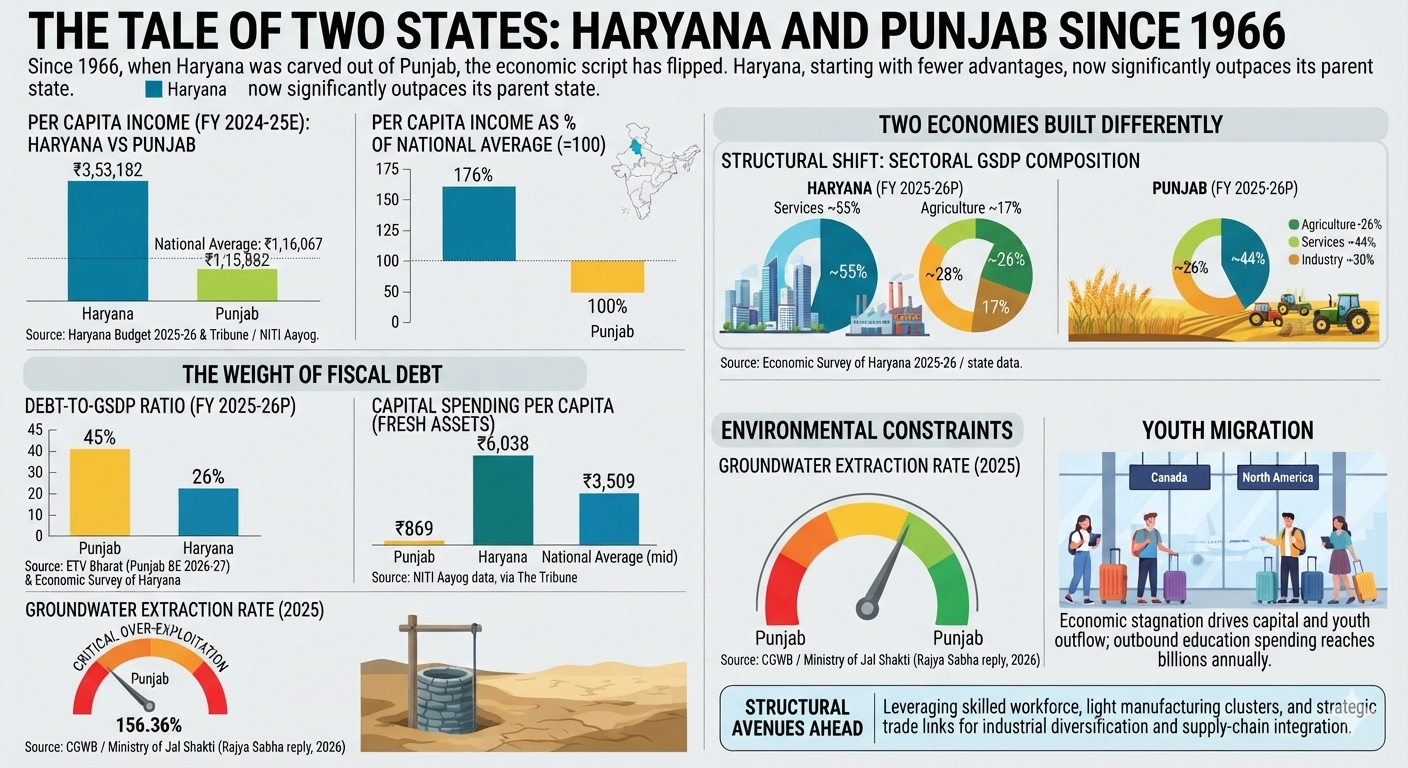
At a Glance
When Haryana was
carved out of Punjab on November 1. 1966, few expected it to outpace its parent
state. Haryana started without a capital of its own, with little industry, and
with none of Punjab’s iconic, canal-fed prestige. Six decades later, that script
has flipped entirely.
Today,
the average resident in Haryana earns significantly more than someone in
Punjab. For 2024–25, Haryana’s per capita income is estimated at ₹3,53,182 –
roughly 176% of the national average, placing it among the highest for any
large state.
 Meanwhile,
Punjab, once India's economic showcase, has drifted down toward the national
average of ₹1,16,067, standing at ₹1,15,882. The pioneer now struggles just to
keep pace.
Meanwhile,
Punjab, once India's economic showcase, has drifted down toward the national
average of ₹1,16,067, standing at ₹1,15,882. The pioneer now struggles just to
keep pace.

Chart 1:
Haryana's per capita income is roughly more than three times Punjab's.
Source: Haryana Budget 2025-26
& Tribune / NITI Aayog

Chart 2:
Measured against the national average (=100), Punjab has fallen to the middle
of the pack.
Source: NITI Aayog State Summary
Report
Two economies
built differently
The contrast stems from structural choices made
decades ago. Haryana pivotally built its modern economy on services (about 55%)
and industry (about 28%), shrinking agriculture’s share to roughly a sixth of
its output.
When
Maruti established its plant in Gurugram in the early 1980s, it laid the
foundation for an industrial belt through Manesar and Bawal that remains one of
India’s densest manufacturing hubs. Successive state governments maintained
regulatory stability – streamlining clearances, land acquisition, and power
supply for factories without upending prior commitments.
In
contrast, Punjab doubled down on its legacy strengths. The Green Revolution’s
wheat-and-paddy model was so lucrative that state politics reorganized around
preserving it through guaranteed procurement (MSP) and free power for
irrigation. Agriculture still drives over a quarter of Punjab’s economy – a
threshold Haryana crossed below more than a decade ago. A formula that
generated immense wealth in the 1970s was maintained long after its growth
momentum faded.

Chart 3: Haryana
has shifted toward industry and services; Punjab remains far more
farm-dependent.
Source: Economic Survey of
Haryana 2025-26 / state data
The
weight of fiscal debt
That structural divergence is visible in state balance sheets. Punjab’s
debt-to-GSDP ratio is projected to reach nearly 45% for 2025–26, which is among
the highest in India and nearly double Haryana’s 26%. With revenues tied up in
interest payments and administrative salaries, public capital for
infrastructure, health, and education has tightened.
This
constraint shows up directly in capital outlay. Punjab’s per capita spending on
fresh physical assets stands at approximately ₹869, which is the lowest in the
country, compared to Haryana’s ₹6,038 and a national average of ₹3,509.

Chart 4:
Punjab's debt burden is nearly twice Haryana's, relative to the size of its
economy.
Source: ETV Bharat (Punjab BE
2026-27) & Economic Survey of Haryana

Chart 5: Punjab
builds fewer new assets per person than almost anywhere else in India.
Source: NITI Aayog data, via The
Tribune
Environmental
constraints
The
agricultural policy framework has also exerted pressure on natural resources.
Free power reduced water pumping costs, accelerating extraction faster than
natural recharge rates. Central Ground Water Board data indicates Punjab’s
groundwater extraction reached 156.36% of its replenishment rate in 2025, with
111 blocks classified as over-exploited.

Chart 6:
Anything above 100% means water is drawn faster than it is replenished. Punjab
leads the country.
Source: CGWB / Ministry of Jal
Shakti (Rajya Sabha reply, 2026)
Youth
migration and economic outlets
Economic
stagnation has accelerated the outward migration of young people. Punjab
remains a primary state of origin for young adults migrating to North America,
particularly Canada, for education and employment opportunities. Outbound
spending on overseas education from the state is estimated at several billion
dollars annually, representing both capital outflow and a shift in domestic
workforce retention.
Structural avenues ahead
These
trends are not immutable. Haryana’s experience demonstrates how policy
continuity, targeted infrastructure investment, and industrial integration can
alter a state's economic trajectory over a few decades.
Punjab
retains structural advantages: a skilled workforce, established light
manufacturing clusters around Ludhiana and Jalandhar, and strategic trade
links. Capitalising on broader national shifts, such as supply-chain expansion
and industrial diversification, presents a clear path to updating its economic
model.
Sources
Frequently Asked Questions
1. Why did Haryana’s economy outpace Punjab’s when it started with fewer advantages in 1966?
The divergence comes down to structural economic choices. Haryana shifted its economic focus heavily toward modern services (55%) and manufacturing (28%), anchor-built by industrial hubs like Gurugram, Manesar, and Bawal. Successive governments maintained regulatory stability, making it easy for industries to clear land, acquire power, and set up operations. Punjab, on the other hand, doubled down on its highly lucrative Green Revolution agricultural model, keeping its politics and policies focused on grain procurement and free irrigation power. This left Punjab far more dependent on farming long after its initial growth momentum faded.
2. How does the fiscal health of Punjab compare to Haryana?
Punjab faces a significantly higher debt burden and lower public spending capacity compared to Haryana:Debt Burden: Punjab’s debt-to-GSDP ratio is projected to hit nearly 45%, which is almost double Haryana’s 26%.Infrastructure Spending: Because so much of Punjab’s revenue goes toward interest payments and administrative salaries, its per capita spending on fresh physical assets (infrastructure, schools, hospitals) sits at just ₹869—the lowest in India. In contrast, Haryana invests ₹6,038 per person in new assets.
3. What are the main environmental and social challenges currently facing Punjab?
Punjab is dealing with severe environmental strain and high rates of youth migration:Water Crisis: The policy of free power for irrigation accelerated groundwater pumping far past natural recharge rates. Punjab leads the country in groundwater extraction, drawing water at 156.36% of its replenishment rate.Brain Drain: Economic stagnation has caused a massive outward migration of young adults looking for better opportunities in North America and Canada. This creates a significant capital outflow, with families spending billions of dollars annually on overseas education.